Programming and Debugging
There are currently two ways of programming the nRF9160 Feather. You can use the built-in bootloader or use an external programmer.
Bootloader use
Currently the nRF9160 Feather uses the MCUBoot bootloader which comes standard with the nRF Connect SDK. It is the recommended way to load new firmware onto your nRF9160 Feather.
Using newtmgr
Note: v5 of the nRF9160 Feather no longer requires manual usage of the
Mode + Reset pins. It’s placed into bootloader mode automatically using the
zephyr-tools CLI.
newtmgr comes with the VSCode extension. To learn more about configuring it
see the setup page for your respective operating system:
Pre-check: MCUBoot needs to be enabled in your project before you can use
it! Make sure that you have CONFIG_BOOTLOADER_MCUBOOT=y in your prj.conf
-
Put your nRF9160 Feather into DFU mode.
- Hold the MODE button
- Then tap the RST button while holding mode
- Hold the MODE button until the Blue LED illuminates
V5 and newer note: you can now get the nRF9160 Feather into bootloader mode by running
zephyr-tools -binside VSCode. This command is currently unsupported in Windows. -
Building your application if you haven’t already with
west build. It will create a folder calledbuild. The file we care about isbuild/zephyr/app_update.bin -
Load the file using the Zephyr Tools: Load via Bootloader task. Here’s what it’s doing behind the scenes:
Note:
- The transfer process is limited to 1M BAUD. In most cases it takes <15 seconds to transfer application code.
- The nRF9160 Feather does not respond to
newtmgrcommands unless it’s in DFU mode. (See step 1 above to get it into DFU mode.) - If you’re having trouble completing a transfer you can also add these parameters to the end:
-r 3 -t .1
Requirements for external programming and debugging
You can also use external programmers with the nRF9160 Feather. Here are some external programmers in preferred order:
- Raspberry Pi Debug Probe ($12 USD)
- nRF5340-DK ($49 USD)
- nRF9160-DK($155 USD)
🚨Important: the nRF52 and nRF51 based development kits do not work with the nRF9160 Feather!
👉Additionally, you’ll also need a Tag-Connect cable. The nRF9160 Feather was designed to use the TC2030-CTX-NL. For more information check out Tag-Connect’s product page.
👉 Raspberry Pi Debug Probe requires an adapter board to connect to the Tag Connect cable.
Installing programmer software
In this next section, I’ll be focusing on using the nRF5340-DK as the programmer of choice. These steps should not be different from other J-Link supported boards.
- Download your version of the nRF Command Line Tools
Windows
-
Then, run the
.exethat was downloaded. It will do all the heavy lifting for you. -
Run
nrfjprogin acmdwindow to make sure your install is working. -
You may also have to add
JLink.exeto your path. It’s the exact same proceedure as addingnewtmgrexcept the path you’re adding isC:\Program Files (x86)\SEGGER\JLink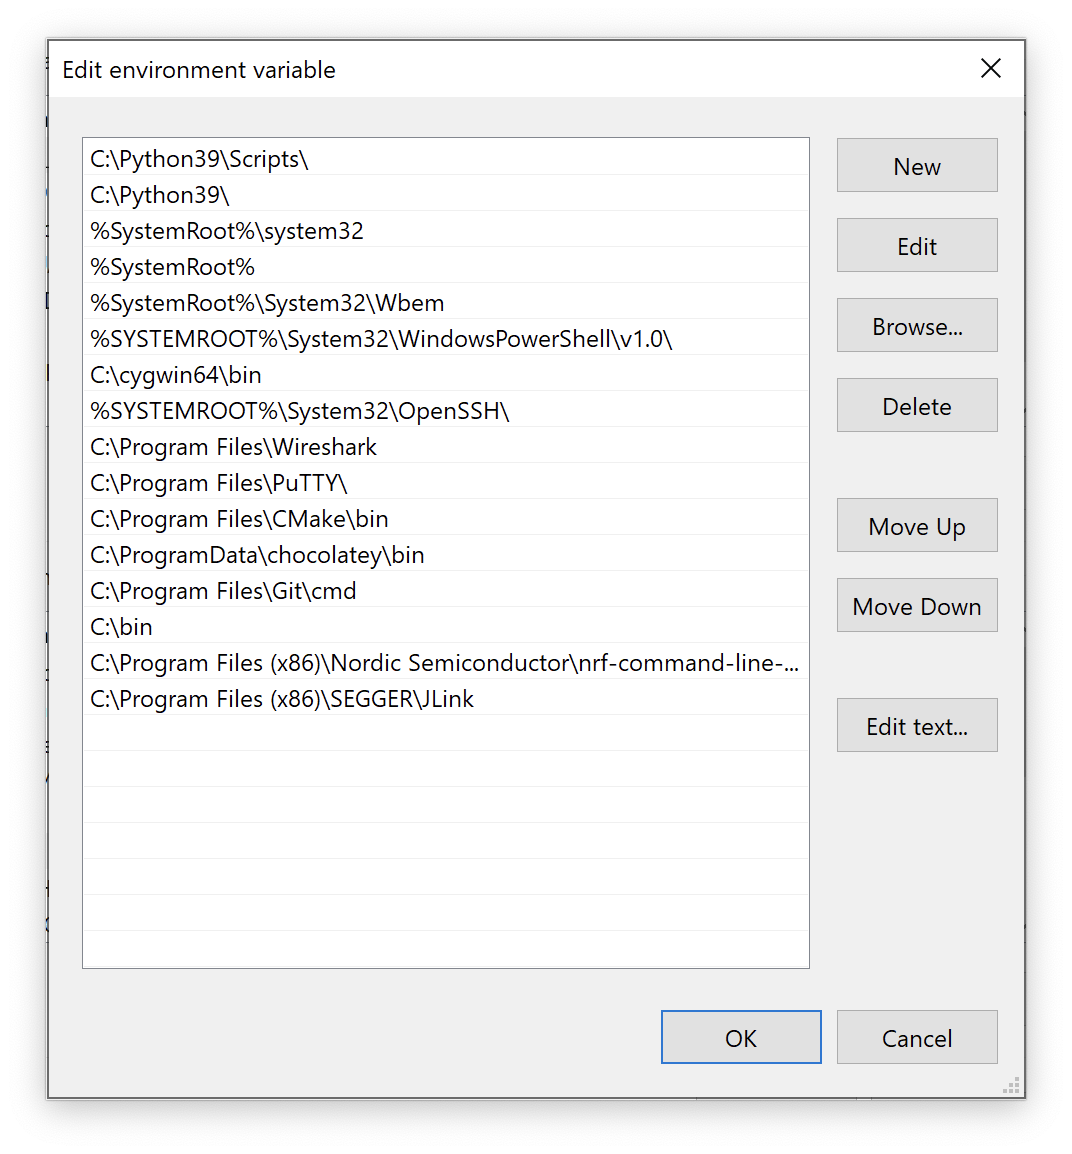
-
Close/restart VSCode and your Command Prompt
-
Run
jlink.exeand make sure it opens.> jlink.exe SEGGER J-Link Commander V6.86f (Compiled Oct 23 2020 18:01:48) DLL version V6.86f, compiled Oct 23 2020 18:00:13 Connecting to J-Link via USB...O.K. Firmware: J-Link OB-K22-NordicSemi compiled Jan 21 2020 17:33:01 Hardware version: V1.00 S/N: 960083363 License(s): RDI, FlashBP, FlashDL, JFlash, GDB VTref=3.300V Type "connect" to establish a target connection, '?' for help J-Link>
Mac
- First run
nRF-Command-Line-Tools_10_9_0_OSX.pkg - Once that install is done, run
JLink_MacOSX_V680a.pkg - Open a fresh terminal window and run
nrfjprogandjlinkexeto make sure your install is complete.
Setting up the nRF5340-DK
Here are a couple of close up shots of how to connect the nRF5340-DK:
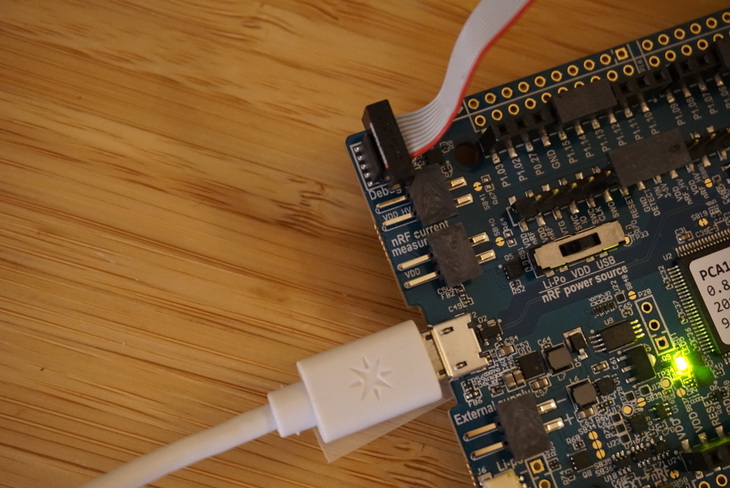
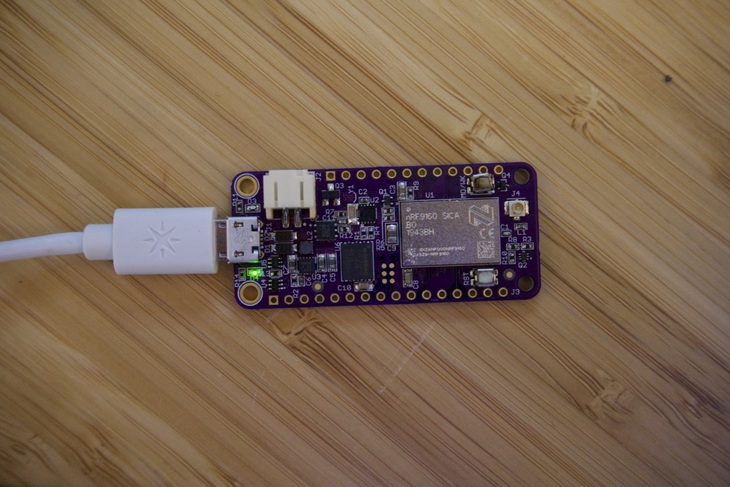
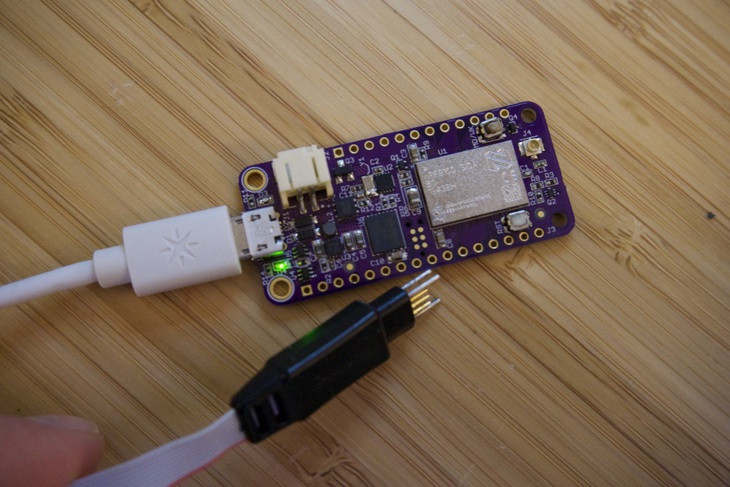
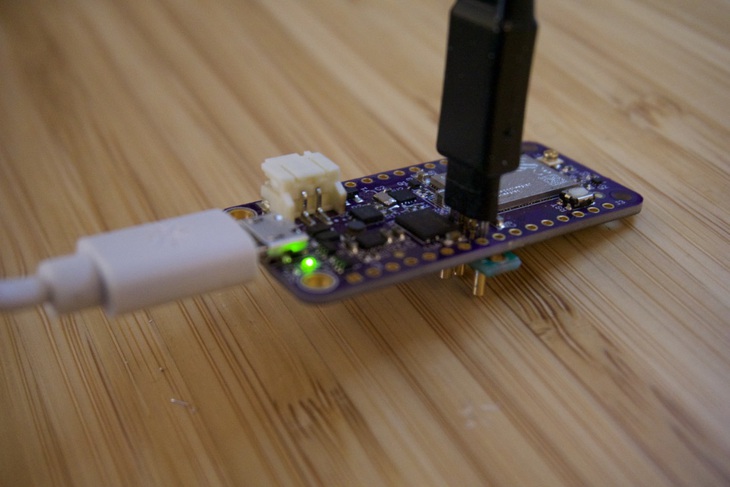
I highly recommend you jump SB47 on your nRF5340-DK with some solder. This forces the debugger to think an external devices is permanently connected. If you’re only doing external debugging, this is very useful.
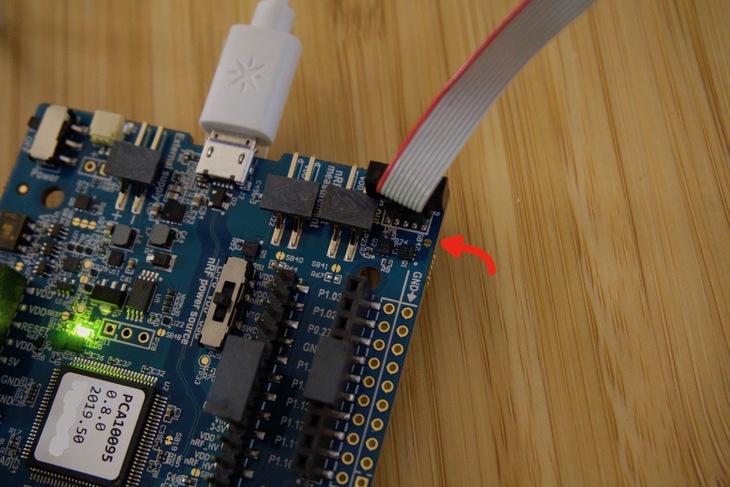
After hooking things up, It’s time to do a quick smoke test. Running
nrfjprog -r in a terminal should show this result:
$ nrfjprog -r
Applying system reset.
Run.
Success!
Note: these pictures are with an early version of the nRF9160 Feather. The procedure is the same. The orientation of the Tag-Connect though is horizontal not vertical as seen in the pictures.
Securing the Bootloader
By default, MCUboot uses a built-in signing key that is not secure. You’ll see this warning during build:
WARNING: Using default MCUboot signing key file, this file is for debug use only and is not secure!
To deliver secure over-the-air updates, you need to generate your own signing key. Here’s the process:
-
Generate an ECDSA-P256 key using
imgtool:pip install imgtool imgtool keygen -k your-signing-key.pem -t ecdsa-p256 -
Place the
.pemfile in your application root directory (next toprj.conf). -
In your
sysbuild.conf, point to the key file:SB_CONFIG_BOOTLOADER_MCUBOOT=y SB_CONFIG_BOOT_SIGNATURE_KEY_FILE="${APPLICATION_CONFIG_DIR}/your-signing-key.pem" -
Then start a pristine build using west:
west build -b circuitdojo_feather_nrf9160_ns -p --sysbuildMake sure you’re building with
--sysbuildor have it enabled in the VSCode extension (on by default).
A pristine build should happen before releasing so the version data is up to date. For newer versions of the SDK, the update artifact is located at build/dfu_application.zip instead of app_update.bin.
It’s critical not to lose your-signing-key.pem as it’s the key for (secure) OTA updates to succeed.
Programming with the nRF5340-DK
Programming with the nRF5340-DK is straight forward in Zephyr using west.
Here’s what it looks like:
west build -b circuitdojo_feather_nrf9160_ns -p
west flash --runner nrfjprog
nrfjprog -r
In the above, i’m:
- Doing a pristine build of my application with the nRF9160 Feather as the target.
- Then flashing using the
nrfjprogrunner option. This is preferred for all J-Link boards. - Resetting the board using
nrfjprog -r. As of this writing,westdoes not reset the board after programming.
Getting a modem trace
Sometimes, you may be requested to get a modem trace of your device. This section will focus on helping you get one for your nRF9160 Feather.
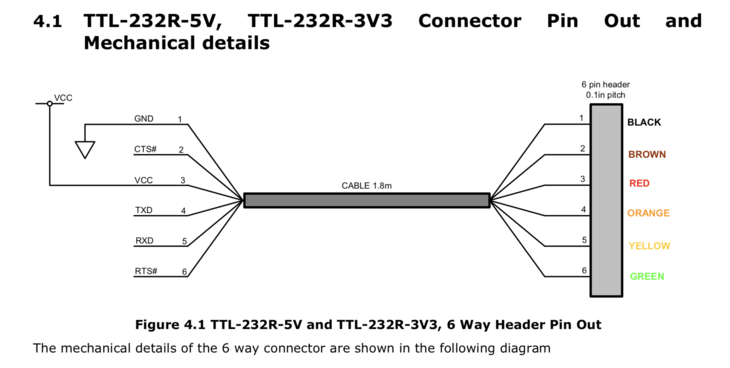
In order to get a modem trace, the TX and RX pins on your board need to be free. You’ll also need a UART to USB adapter of some type. I used an FTDI one that has each of the lines broken out.
-
First, set your
prj.confto include the following lines:# Trace CONFIG_NRF_MODEM_LIB_TRACE=yNote: older versions of NCS use a different value. Ex:
CONFIG_NRF_MODEM_LIB_TRACE_ENABLED=yThese lines are optional:
# AT host library CONFIG_UART_INTERRUPT_DRIVEN=y CONFIG_AT_HOST_LIBRARY=y -
Then, create a folder in your project/sample called
boardsand add a new file calledcircuitdojo_feather_nrf9160_ns.overlayWe’ll want to enable the UART1 interface on pins 23 and 24 like below:/ { chosen { nordic,modem-trace-uart = &uart1; }; }; &i2c1 { status = "disabled"; }; &uart1 { current-speed = <1000000>; pinctrl-0 = <&uart1_alt>; pinctrl-1 = <&uart1_sleep_alt>; pinctrl-names = "default", "sleep"; }; &pinctrl { uart1_alt: uart1_alt { group1 { psels = <NRF_PSEL(UART_TX, 0, 24)>, <NRF_PSEL(UART_RX, 0, 23)>; }; }; uart1_sleep_alt: uart1_sleep_alt { group1 { psels = <NRF_PSEL(UART_TX, 0, 24)>, <NRF_PSEL(UART_RX, 0, 23)>; low-power-enable; }; }; };Important: UART1 is required for a modem trace and it’s configured by the library. You shouldn’t have anything using this peripheral. I2C1 must be disabled.
-
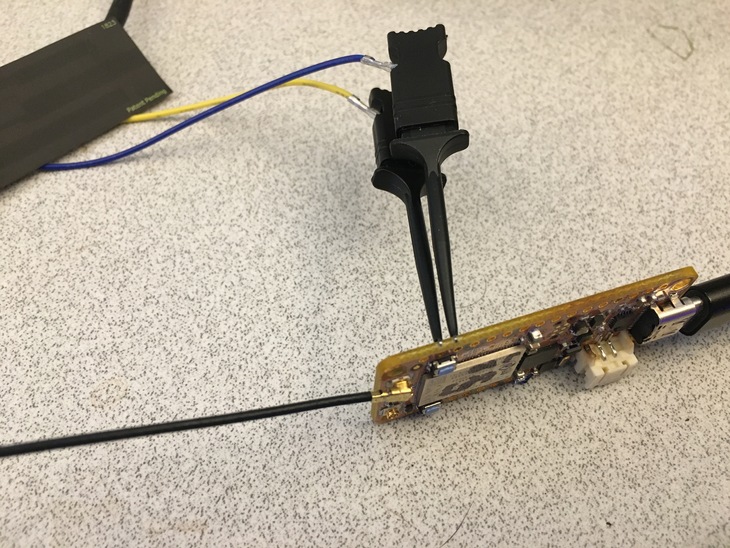
Connect your USB to UART adatper. I’ve used clips from my logic analyzer to hold the wires in place. Connect the yellow wire to the TX on the board. Connect the orange wire to the RX on the board.
-
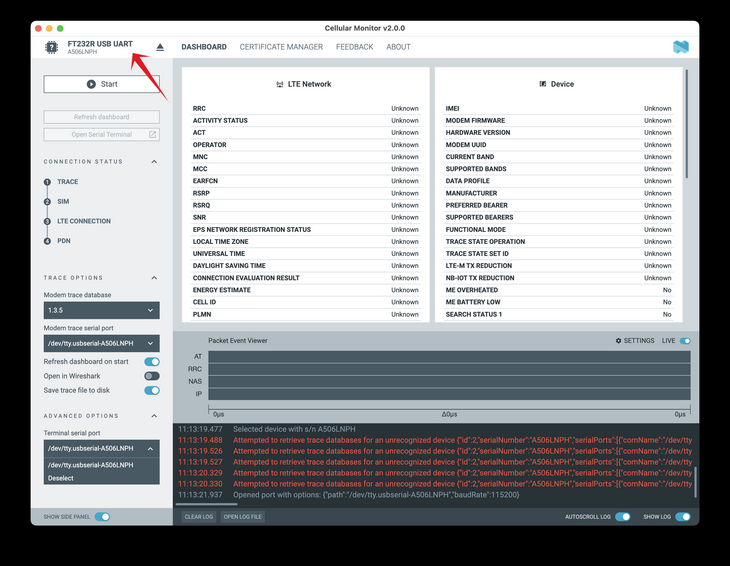
Then open the serial port in the modem trace App and click start.
-
Then run your app as normal. You should see the Trace size go up little by little as connections are made, etc.
-
You can capture without opening in Wireshark or you can open Wireshark and monitor in real time (recomended). You will only see activity during network/modem activity.
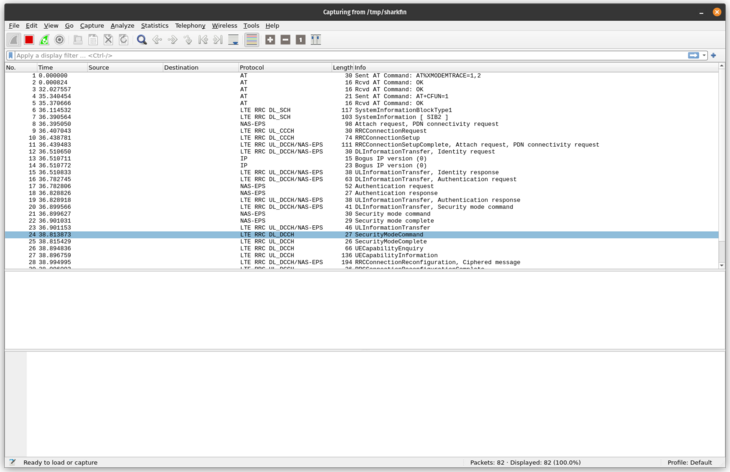
Modem traces contain raw protocol-level data that can help diagnose cellular registration failures, TLS handshake errors, and other connectivity issues. The trace data follows the 3GPP format and can be decoded by Wireshark with the appropriate dissectors.
Debugging in Visual Code
Debugging your application is possible with Visual Code. You will need a J-Link programmer and a Tag Connect (TC2030-CTX-NL) cable for this process. Programmers include the nRF9160 DK, nRF532 DK, J-Link EDU (if your project is non-profit) and the standard commercial J-Link programmers.
Here’s the process:
-
Download and install your version of the nRF Command Line Tools
-
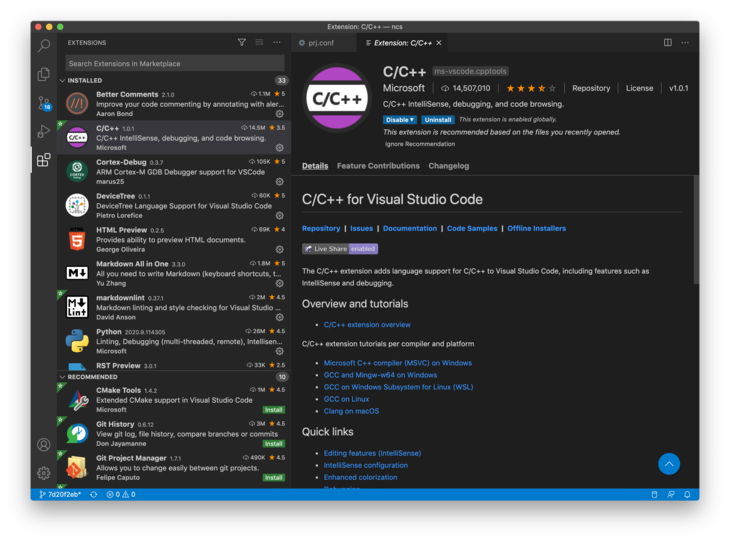
Install the C/C++ Extension and the Cortex-Debug extensions. They’re both very handy in development and debugging of Zephyr based projects.

-
If you don’t have one already, create a
.vscodefolder in the root of your project.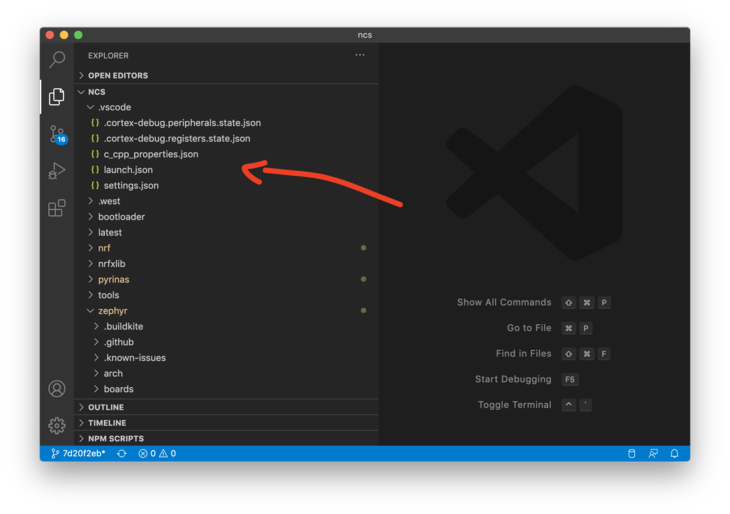
-
Create a file called
launch.json. This is where we’ll set up the configuration for debugging. -
Here’s a real example of a config I was using to debug a project in OSX:
{
  // Use IntelliSense to learn about possible attributes.
  // Hover to view descriptions of existing attributes.
  // For more information, visit: https://go.microsoft.com/fwlink/?linkid=830387
  "version": "0.2.0",
  "configurations": [
    {
      "name": "Cortex Debug",
      "cwd": "${workspaceRoot}",
      "executable": "${workspaceRoot}/pyrinas/applications/application/build/zephyr/zephyr.elf",
      "request": "launch",
      "type": "cortex-debug",
      "servertype": "jlink",
      "device": "nrf9160_xxAA",
      "interface": "swd",
      "armToolchainPath": "/Users/jaredwolff/gcc-arm-none-eabi-9-2019-q4-major/bin"
    }
  ]
}
For folks on Windows you’ll have to modify appropriately:
{
 // Use IntelliSense to learn about possible attributes.
 // Hover to view descriptions of existing attributes.
 // For more information, visit: https://go.microsoft.com/fwlink/?linkid=830387
 "version": "0.2.0",
 "configurations": [
    {
        "name": "Cortex Debug",
        "cwd": "${workspaceRoot}",
        "executable": "${workspaceRoot}\\nrf9160-feather\\samples\\blinky\\build\\zephyr\\zephyr.elf",
        "request": "launch",
        "type": "cortex-debug",
        "servertype": "jlink",
        "device": "nrf9160_xxAA",
        "interface": "swd",
        "armToolchainPath": "C:\\Program Files (x86)\\GNU Tools Arm Embedded\\9 2019-q4-major\\bin"
    }
 ]
}
Remember that
workspaceRootrefers to the folder you have opened in VSCode. This will most likely beC:\Users\<your username>\ncs\v1.5.0\nfed\. (/opt/nordic/ncs/v1.5.0for Mac) You will have to modify the"executable"entry to match the path of yourzephyr.elffile. -
Change the executable path and the armToolchainPath to reflect your system. Make sure you point the executable option to the
.elffile that gets produced during the compilation process. -
Next, go to your projects
prj.confand disable the bootloader by commenting outCONFIG_BOOTLOADER_MCUBOOT=yor changing theyto an. As of this writing, disabling the bootloader is required as it prevents the debugging process from occuring. -
In
prj.confyou’ll also want to enable theCONFIG_DEBUGoption. This disables compiler optimizations which makes the debug process hairy or impossible. -
Finally, program your project using
west build && west flash -
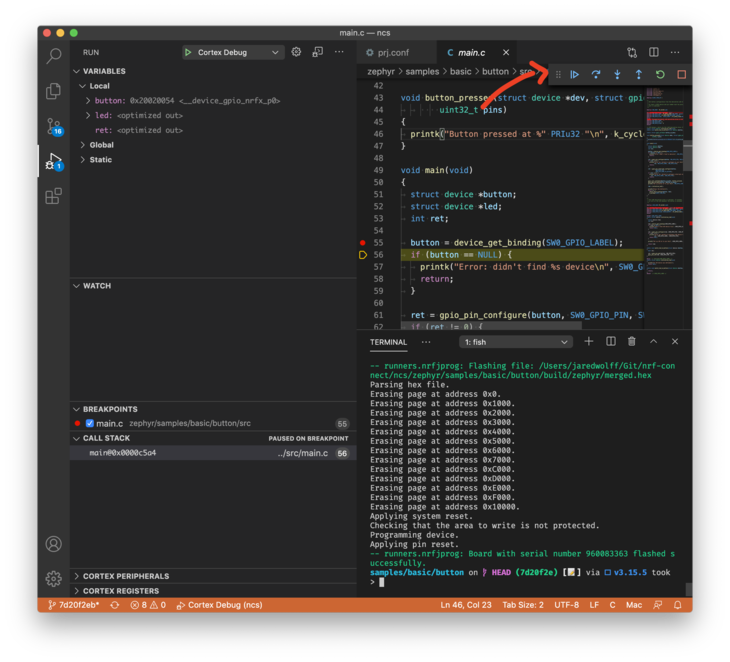
At this point, if you’ve ever done any debugging in Visual Code, you should be able to follow the final steps to debug your application!
-
Set some breakpoints in your code by pressing the line number you want. A red dot will appear where the breakpoint is set.
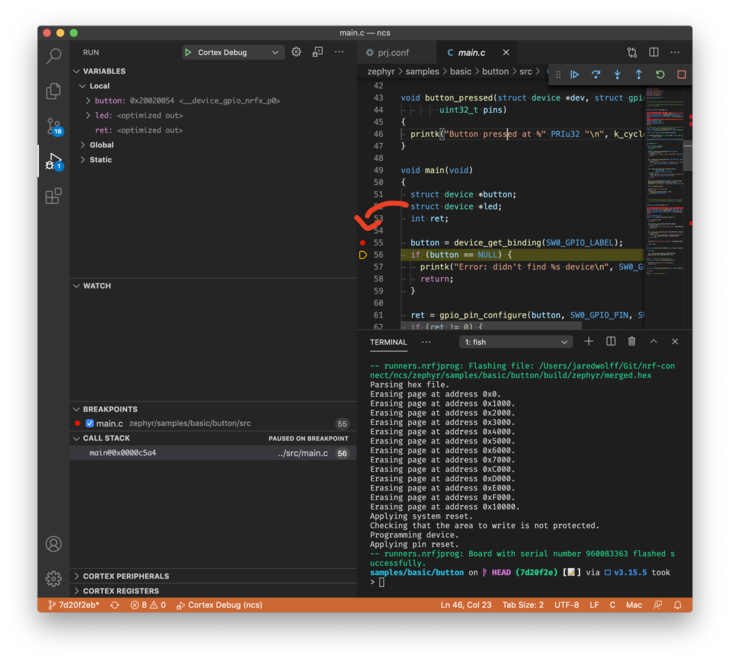
-
Start debugging by clicking the debug icon on the left. Then click the play button in the top left.
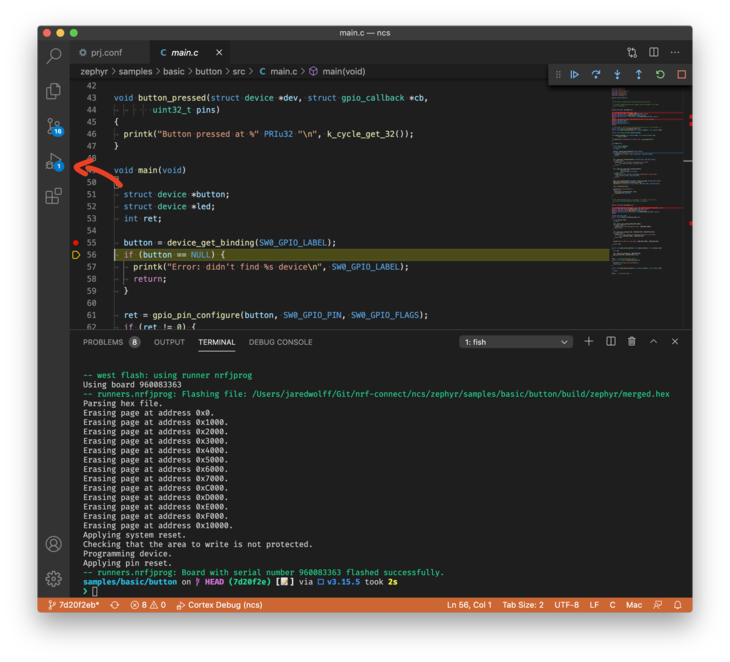
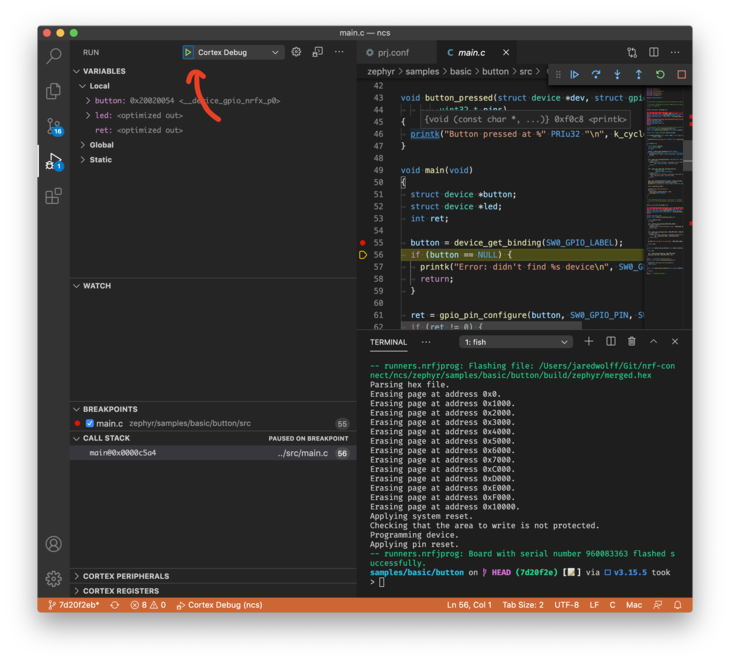
-
You can use the popup menu on the right to control traversal through your code.
