
Debugging in VSCode
Debugging the nRF9151 uses probe-rs as the gdb server. You can easily step through your application in a few steps.
- Install Debugger for probe-rs via the VSCode Marketplace.
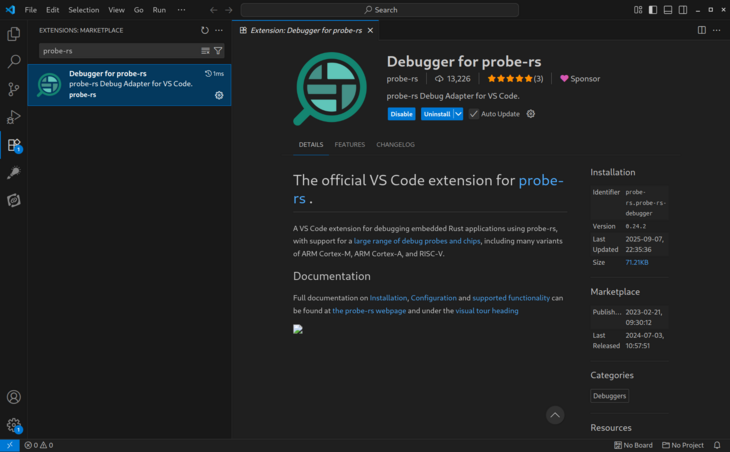
The extension helps facilitate the integration between probe-rs and the built-in debugging facilities of VSCode.
- Add a
.vscode/launch.jsonfile. Here’s an example which is using Circuit Dojo Zephyr Tools:
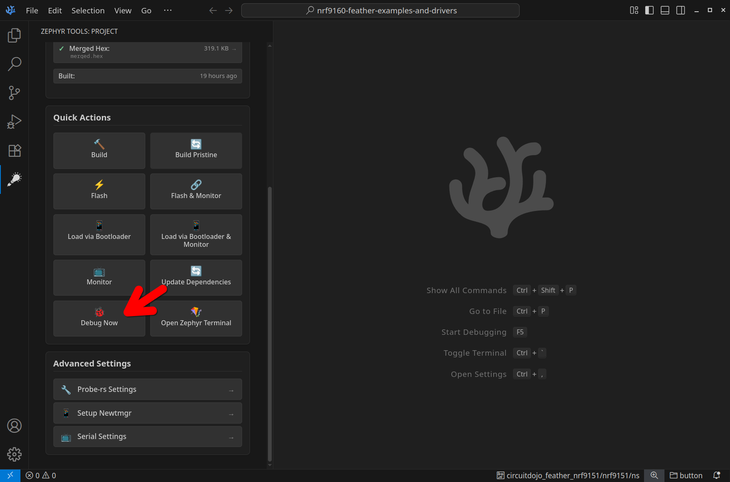
Note: Zephyr Tools handles the creation of your launch.json automatically when clicking the “Debug Now” button.
If you are not using Zephyr Tools you can continue below:
{
  "version": "0.2.0",
  "configurations": [
    {
      "name": "nRF9151 • App (Non-Secure)",
      "type": "probe-rs-debug",
      "request": "attach",
      "chip": "nRF9151_xxAA",
      "cwd": "${workspaceFolder}",
      "speed": 4000,
      "coreConfigs": [
        {
          "coreIndex": 0,
          "programBinary": "${workspaceFolder}/app/app/build/circuitdojo_feather_nrf9151/app/zephyr/zephyr.elf"
        }
      ],
      "consoleLogLevel": "Console"
    }
  ]
}
- Program
merged.hexas normal to your device. In Circuit Dojo Zephyr Tools, you can run theFlashoption:
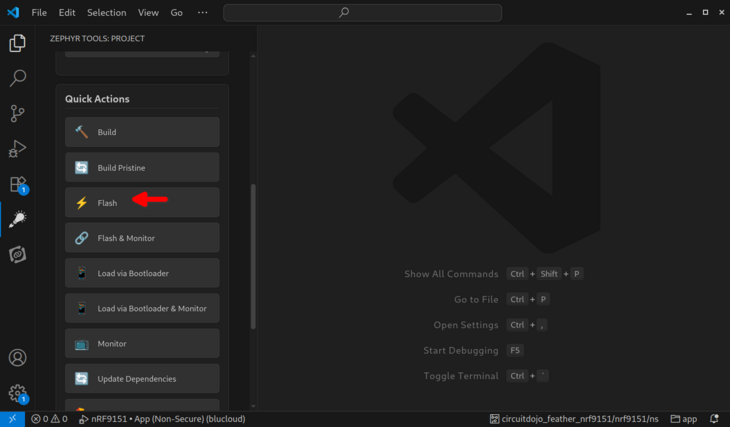
This will flash and start running your code. At any point in the process you can view the console output (via the Monitor button).
- Then, in the debug menu you should see the new launch option that you created:
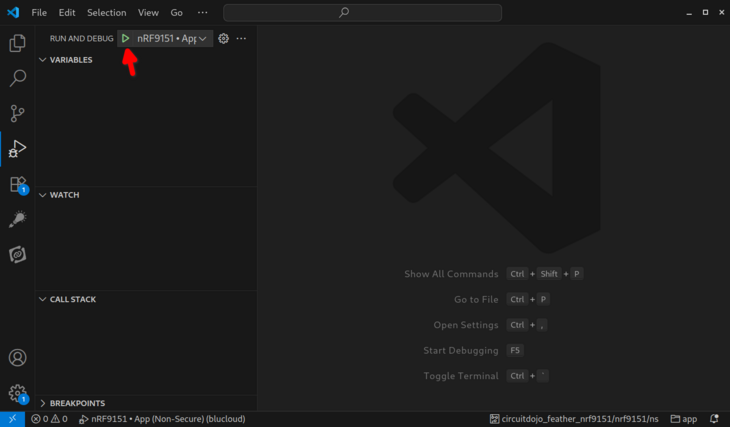
- If the connection is successful, you will see a few indications that debugging is running:
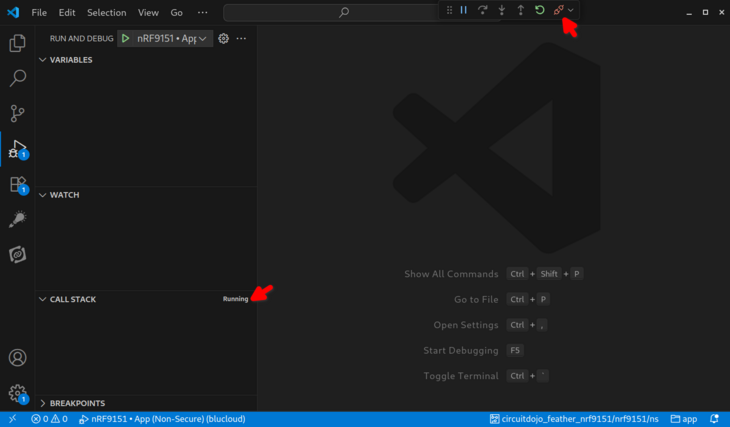
This includes a Running indication in the left debug column. You should also see a red disconnect button on the top next to the debugger controls.
From here you can set halt points as normal and debug your firmware!
For more information on debugging with probe-rs, check out the official documentation.